


Session Insights
Overview
The Session Insights feature for Minoa was designed to expose engagement information and activities occurring within a collaborative document. At a glance, this feature included:

Insights Tab
High level Engagement metrics surface deal health at a glance. Collaborator engagement score identifies stakeholder champions.

History Tab
Granular activity log of interactions occurring in the document. Users get peace of mind without the engineering lift required for full versioning controls.

Visitor Details
Individual engagement detail helps identify at-risk deals vs engaged champions. Document owners can see who changed what, when.

Engagement Scorecard
Snapshot of collaborators relative level of activity in the document. Users can identify high impact content and improve future business cases.
Client Background
Minoa is a value intelligence platform that helps B2B sales teams create collaborative business cases: turning complex ROI spreadsheets into clean, shareable documents that sellers co-create with their prospects. These business cases are living documents that prospects can interact with, not static PDFs.
The platform guides sellers through value selling by providing templated use cases, financial calculations, and AI-powered insights.
Requirements
Competitive Research
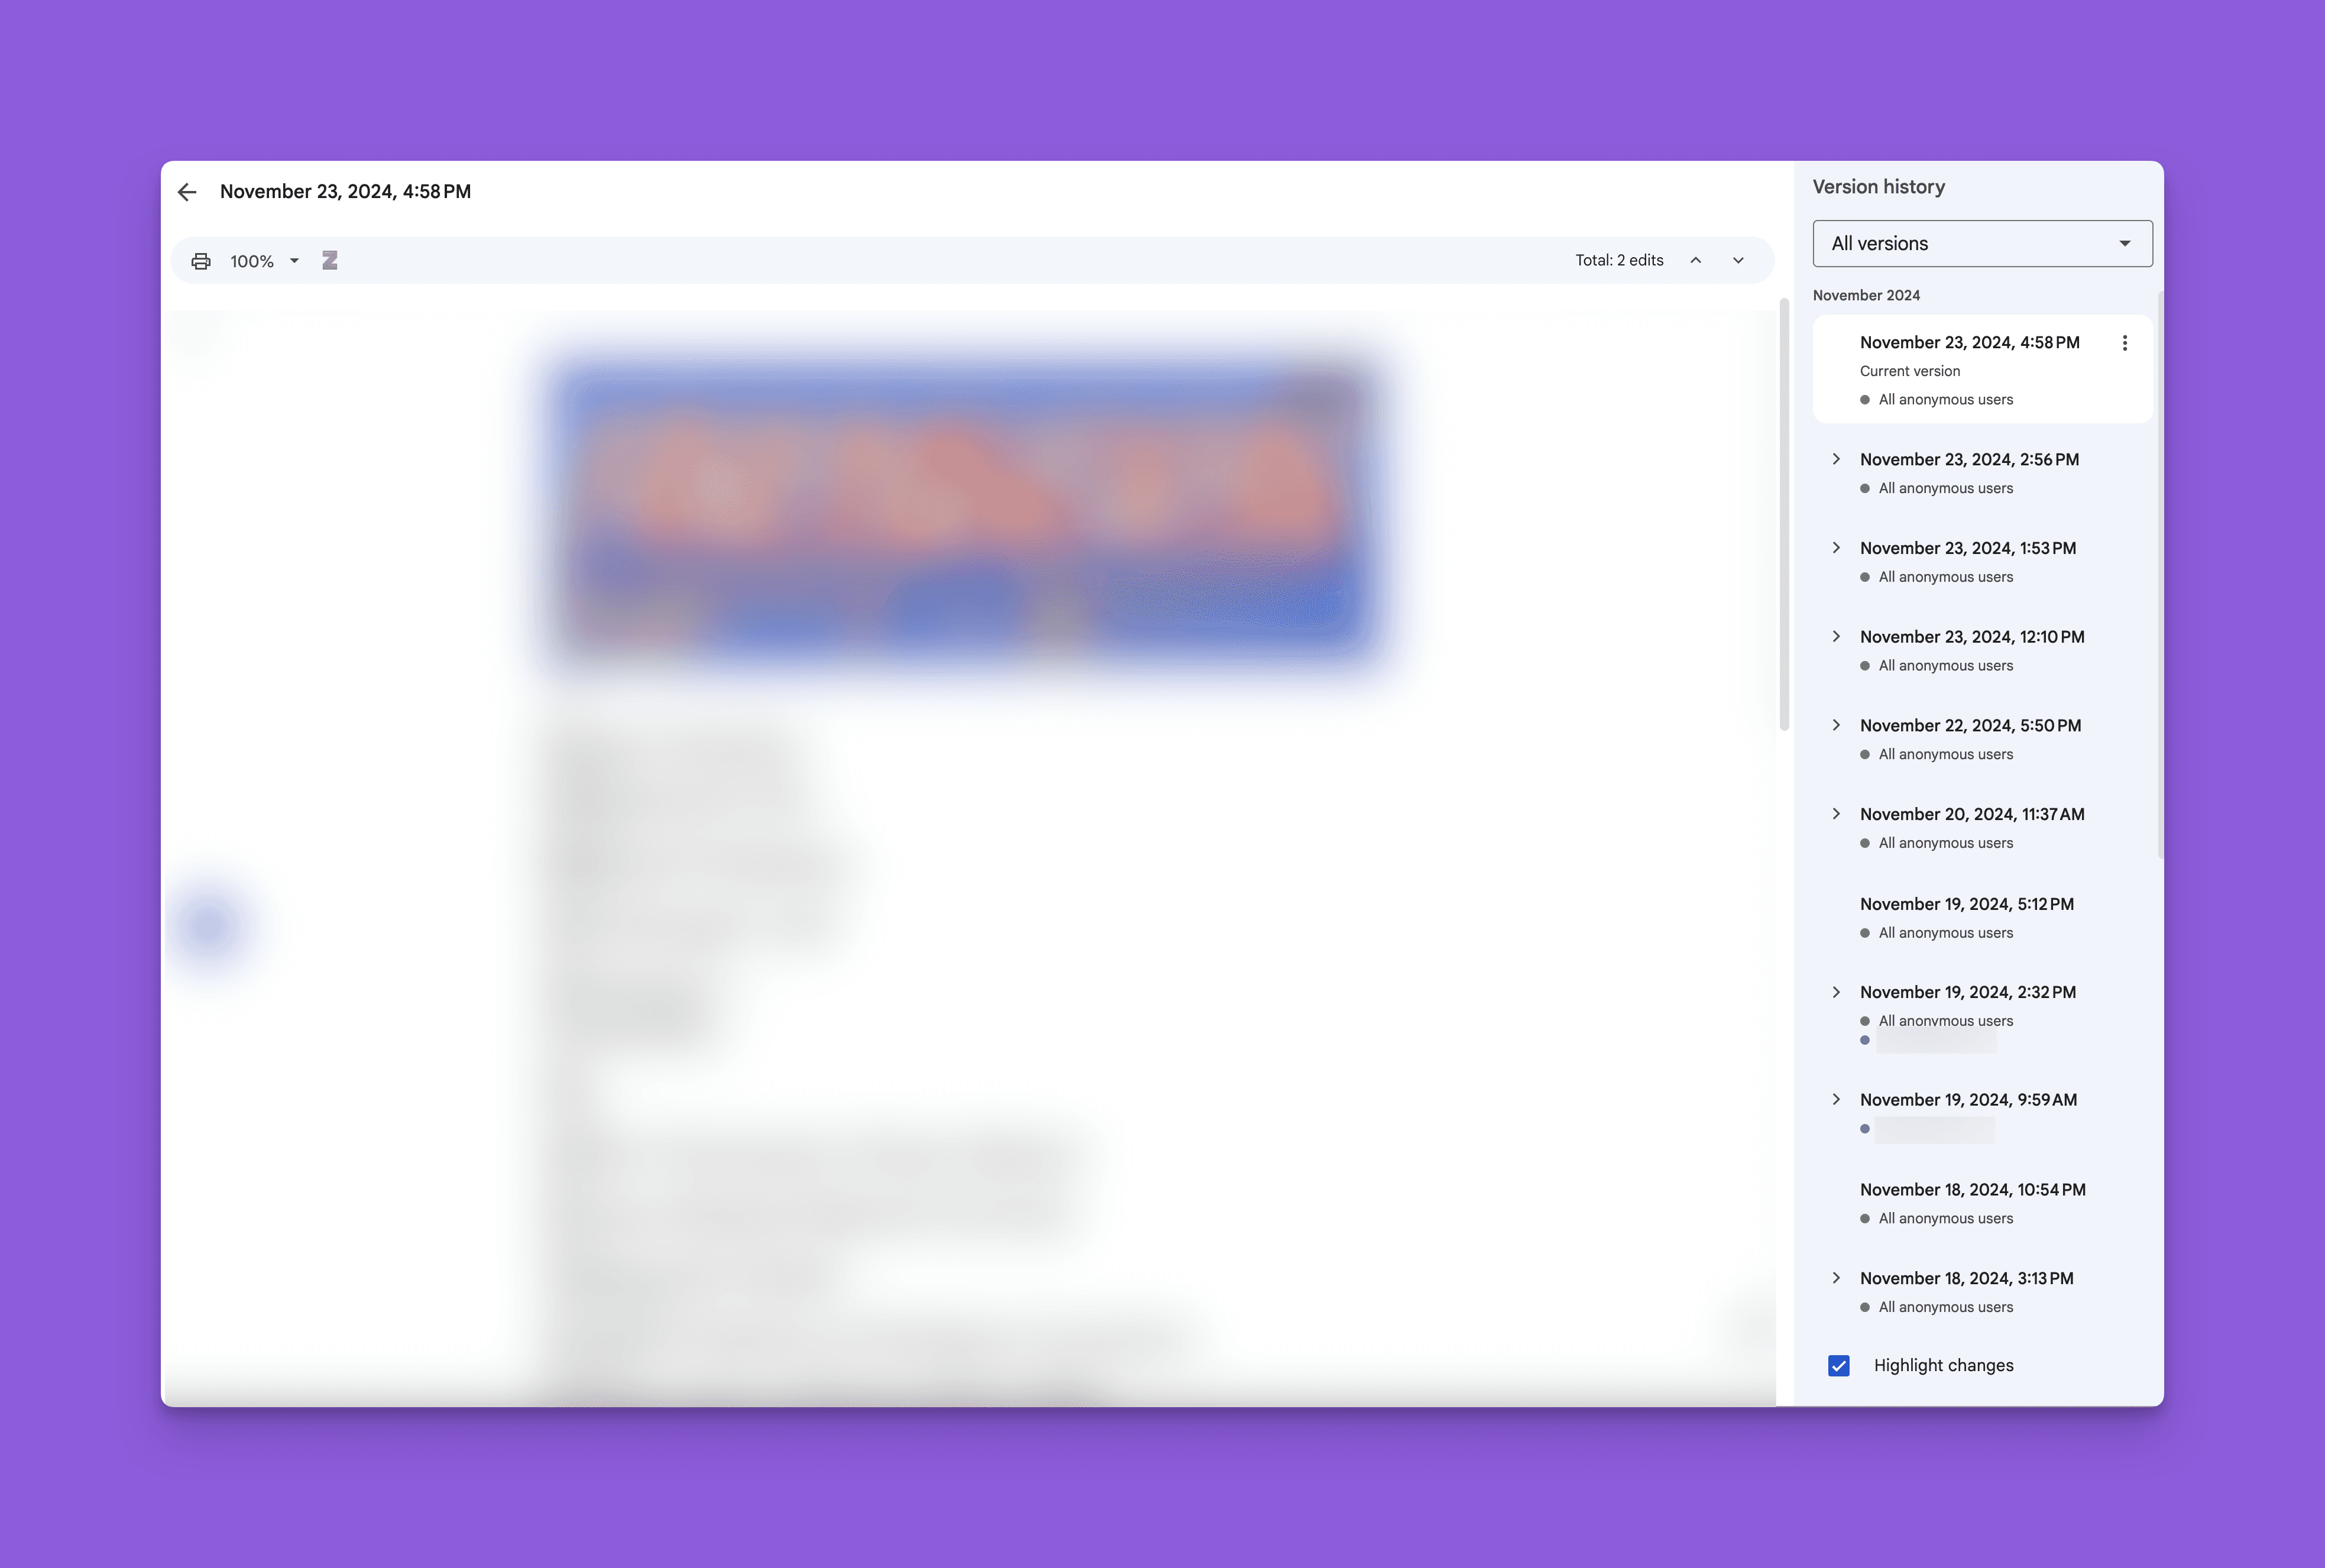
I reviewed a handful of collaborative platforms that surface viewiership insights, looking at what information is called out and how edit history is communicated. Loom and Google Docs were most influential:
Loom - Views
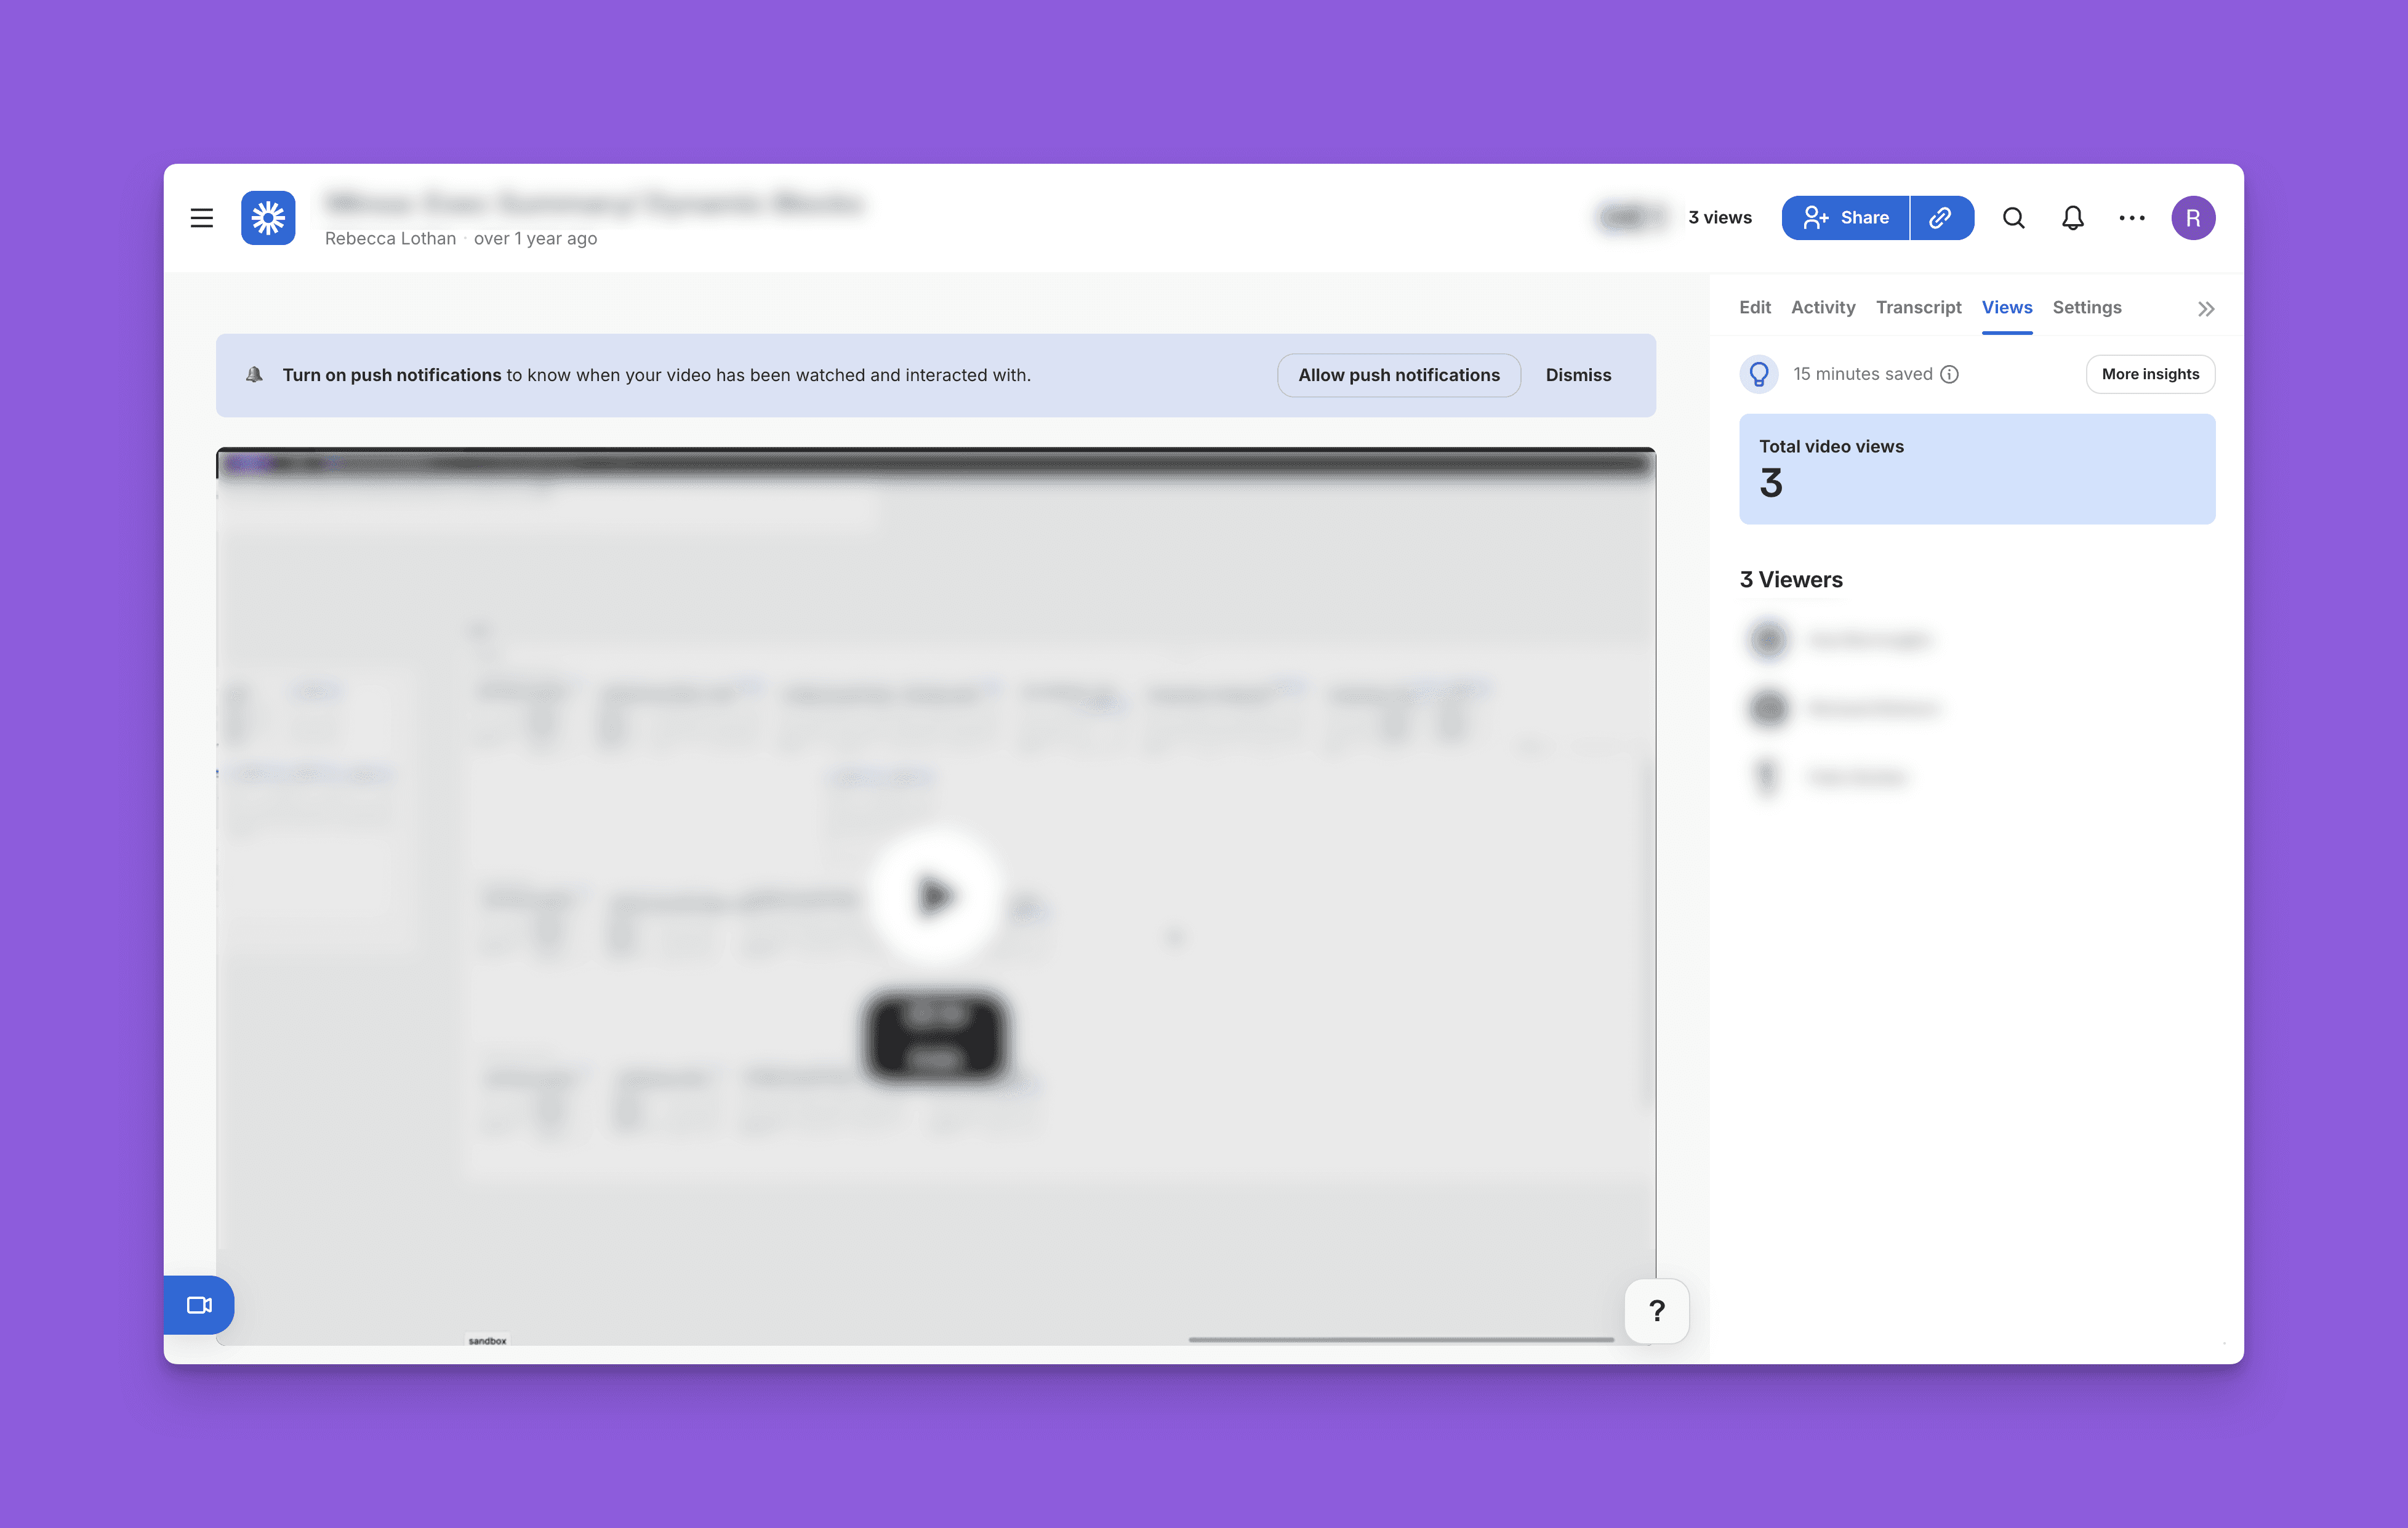
Google Docs - Version History
Insights
Solution
Explore user engagement with the new Session Insights tool. The overview tab provides high level insights into user interaction with the business case. Explore detailed logs of all user actions in the history tab. You can also view each user’s specific activities and a simple engagement score by clicking on the name of a user from the overview tab.
Insights Tab

2
1
2
Collaborators
View all active collaborators and those who have invited, but not accepted. See each users relative engagement score in a bar chart graphic.
History Tab

4
3
4
Action Entries
Time stamped entries with what was changed, by who, and where. Select a user to view detail.
Visitor Details

6
5
5
Engagement Scorecard
View each user’s specific activities and a simple engagement score to help users see if a deal may be in trouble and require intervention.
6
Engagement by Tab
See which parts of the business case got the most attention from your prospect, and learn what works for future business cases.